LinkedIn is pretty stingy with data, and it scatters what it does share across several different pages. If you've ever gone looking for your profile views, follower count, post impressions, or search appearances and couldn't find them, that's why.
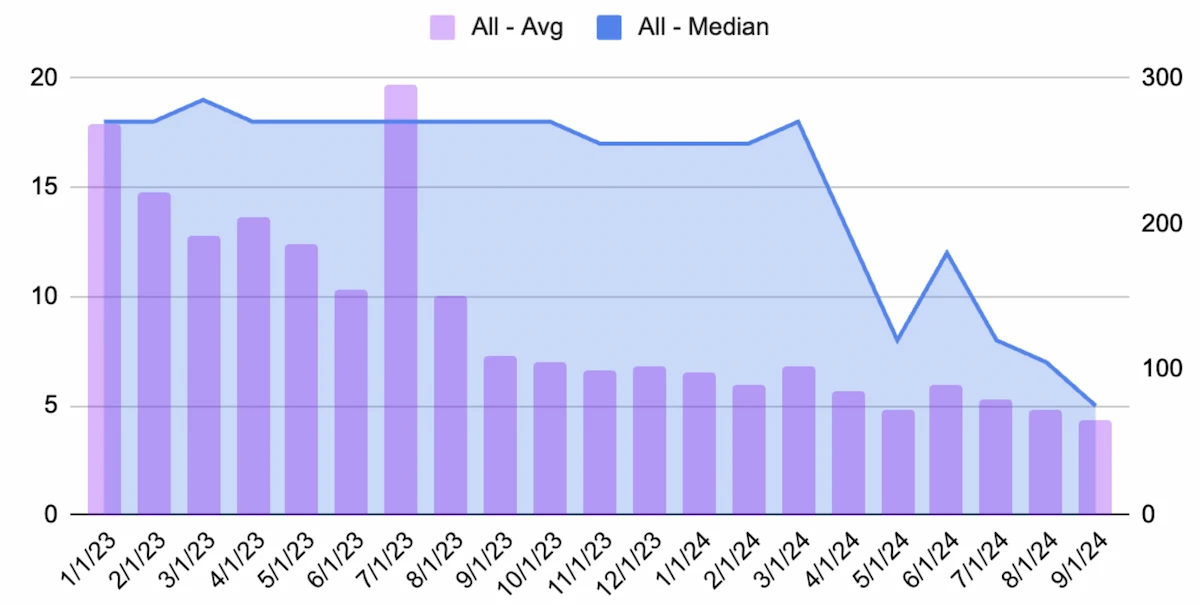
This guide covers all five places where LinkedIn surfaces meaningful statistics, what each tells you, and the direct URLs to get there. It's worth knowing your baseline right now: across my research of 13 million LinkedIn posts, median post engagement dropped 72% between 2023 and 2024. Tracking consistently is the only way to know whether you're ahead of that trend or behind it.
Part of why that number looks so stark is structural. LinkedIn's ad revenue hit $8.2 billion in 2025, growing 18.3% year over year (WARC), with forecasts of $9.7B in 2026 and $11.3B in 2027. LinkedIn's overall revenue grew 9% in fiscal 2025 per Microsoft earnings. Every dollar of that ad growth represents feed inventory that used to go to organic posts. The feed isn't broken; it's just increasingly a paid channel, and the organic slice is shrinking accordingly.
- Profile views, follower count, and connection count each live on separate pages
- Post and article analytics are found via your profile's recent activity, not the main dashboard
- Search appearances show you who's finding you and with what keywords, an underrated signal
- The Social Selling Index (SSI) is mainly useful for salespeople reporting to a manager or client
- For engagement rate and deeper content metrics you'll need a third-party tool. LinkedIn doesn't provide them natively
- Comments drive ~40% of all profile appearances for active creators, nearly as much as posting does
- The strongest predictor of post engagement isn't impressions: it's comments received, which is driven by comments you write
1. LinkedIn Profile Stats
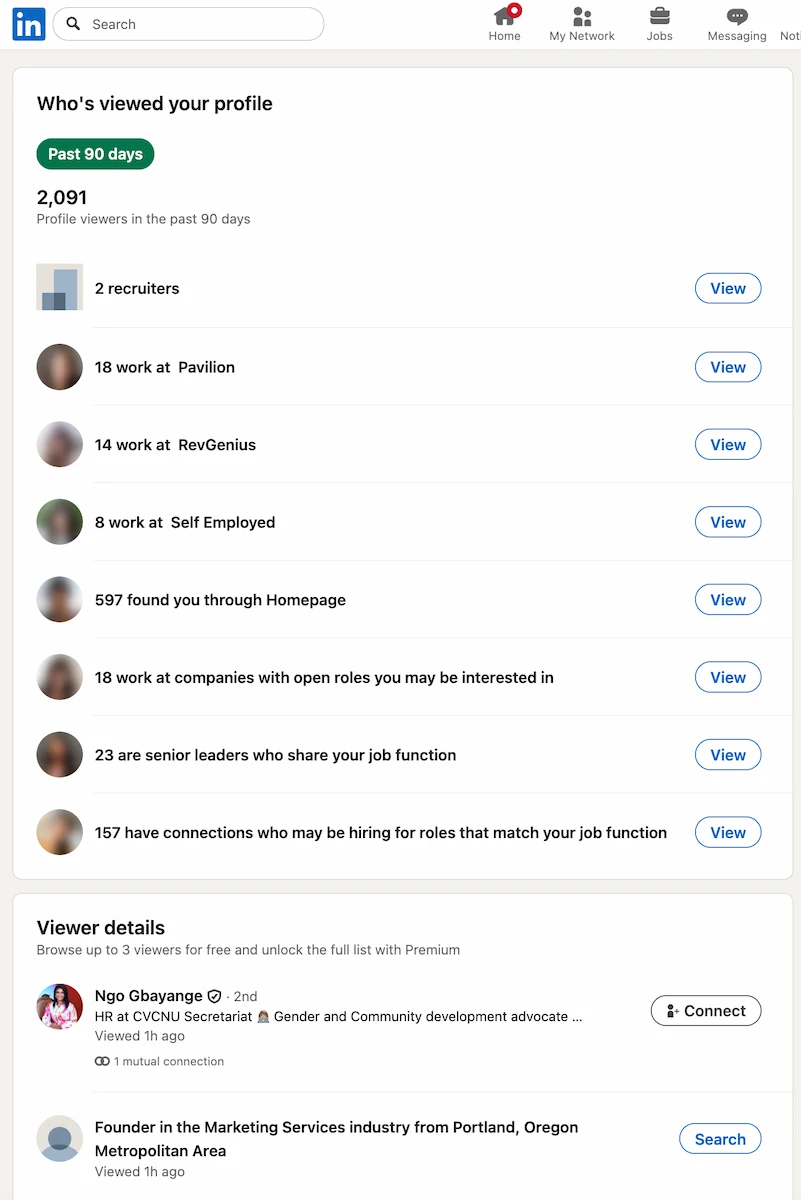
Your basic LinkedIn profile stats—connections, profile views, and followers—are on three separate pages. LinkedIn doesn't put them in one place, which trips up a lot of people.
Profile views (last 90 days):
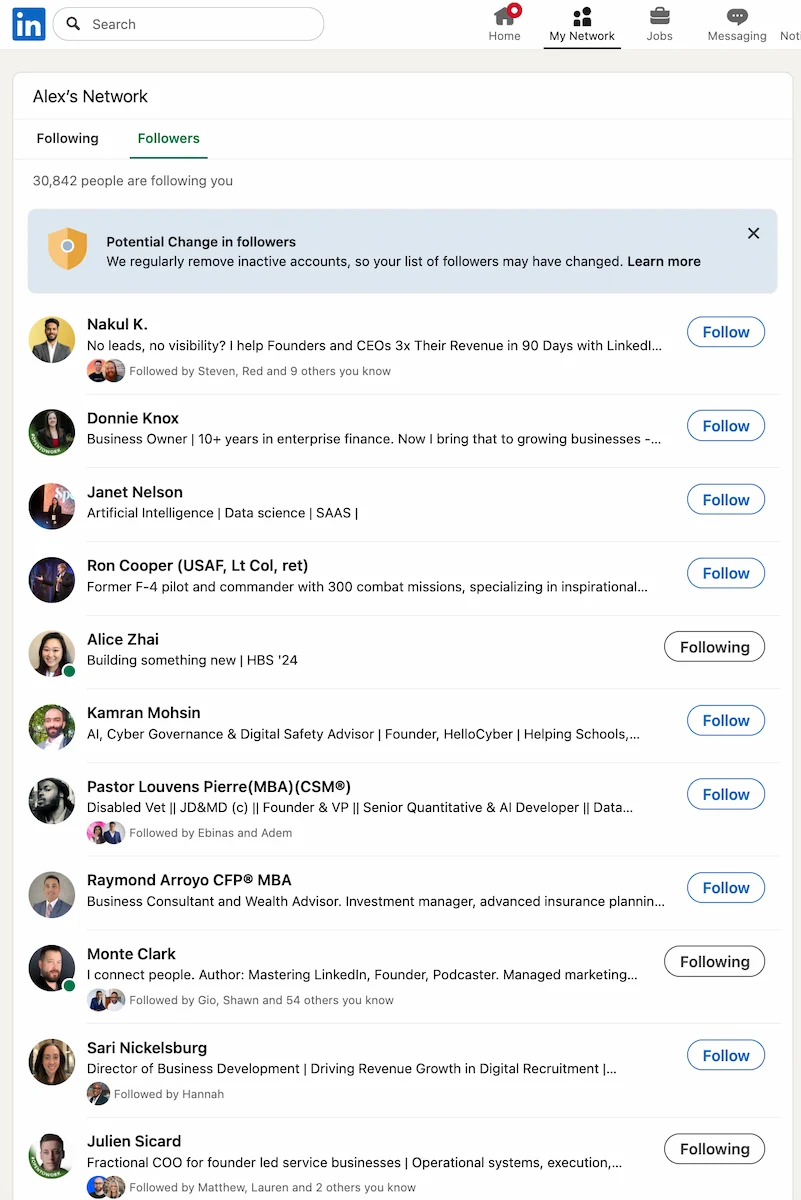
Your followers:
Your connections:
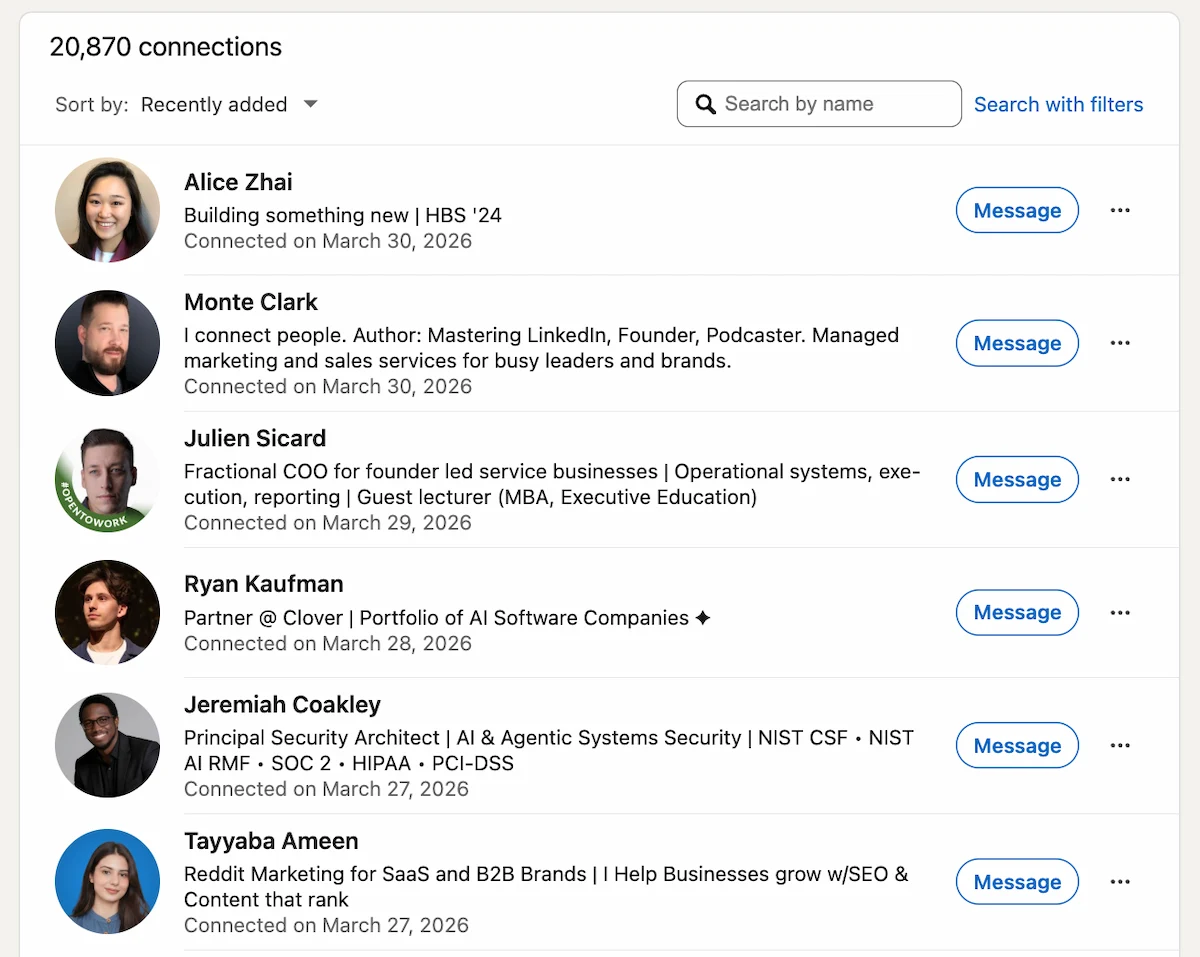
Those three pages give you the basics. What LinkedIn doesn't show you: follower growth over time, new connections per week, or any benchmarking against similar profiles. For that you need a third-party tool.
One thing that does affect your profile stats but isn't visible anywhere: LinkedIn's systems now actively detect AI-generated or fake profile photos and flag them as negative trust signals. According to TrustInsights.ai's algorithm guide, a strong, authentic profile photo generates better human engagement, which feeds both the retrieval and re-ranking systems indirectly. The practical upshot: use a real, high-resolution headshot where your face is clearly visible. An AI-generated image won't just look off to visitors; it may quietly suppress your distribution.
2. Post and Article Analytics
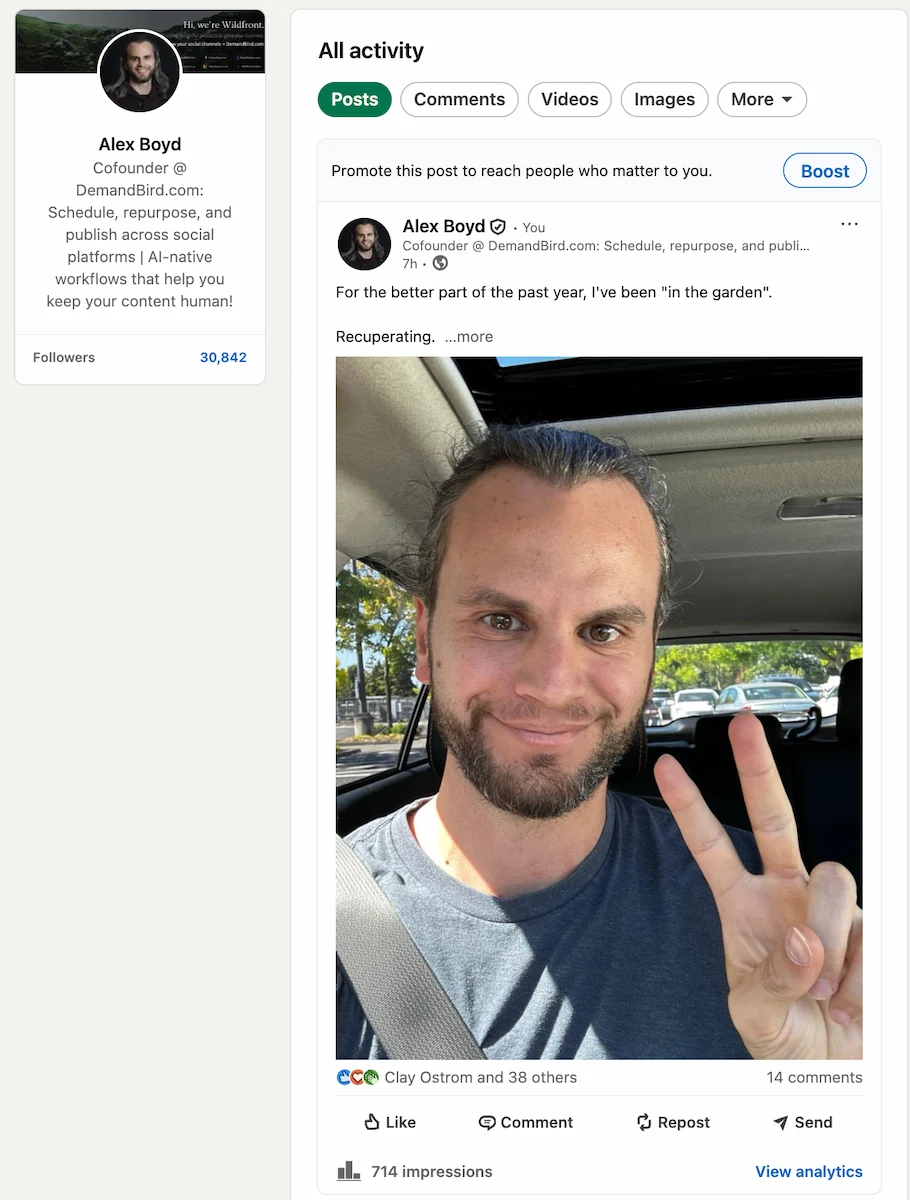
To see stats on your individual posts and articles—impressions, reactions, comments, reposts—go to your recent activity:
From there you can click into any post to see its full performance breakdown, including how many people it reached and how they interacted with it.
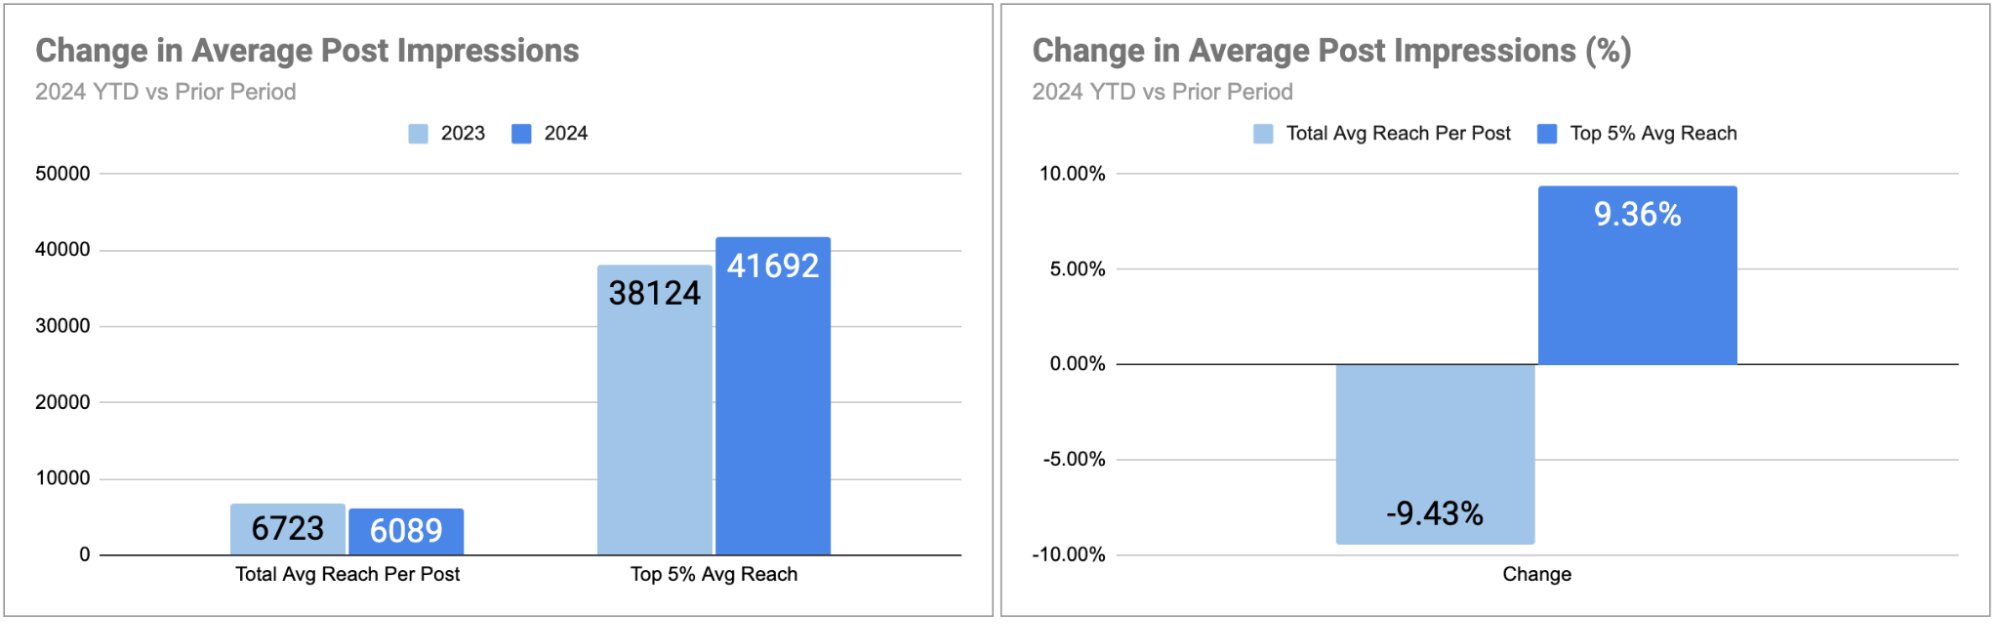
- Typical LinkedIn creator: ~6,100 impressions per post (down from 6,700 in 2023)
- Top 5% creators: ~41,700 impressions per post (up from 38,100 in 2023)
- The gap is widening: top creators grew +9% while the average declined -9%
One gap worth flagging: LinkedIn doesn't show your engagement rate. You have to calculate it yourself (reactions + comments + reposts ÷ impressions × 100), or use a tool that does it for you.
Posting frequency shows up clearly in the data. Creators who posted at least weekly throughout 2023–2024 moved in a completely different direction from those who didn't:
If your post stats feel like they're drifting in the wrong direction, consistency is usually the first variable worth examining.
The contrast is even sharper when you compare active tool users to the overall population. Across the same period, creators using a social media scheduling tool saw their total reach rise +16% and total engagements rise +16–18%, even as average per-post reach fell. The explanation: tool users posted 28% more on average than the prior year. Volume, consistency, and a systematic workflow offset the platform-level headwinds that hit casual posters hardest.
When You Post Also Shows Up in the Data
When comparing two posts and wondering why one underperformed, time of day is often the overlooked variable. Across 13 million posts in September 2024, median engagement peaked for posts published around 5am PT (8am ET) and declined steadily through the afternoon and evening, sometimes by 2–3x.
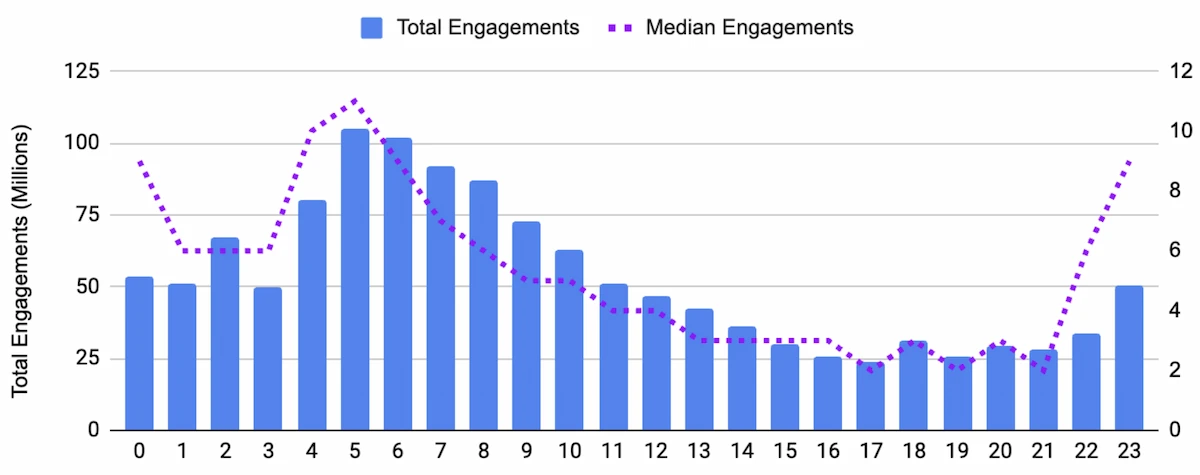
That said, the data is directional, not prescriptive. Your audience's timezone and your own consistency matter more than hitting an exact time. Posting at noon every day will outperform posting at 8am whenever you feel like it.
The Feed Composition Shift That Changes the Math
If your impressions feel unpredictable, there's a structural reason for it. In March 2026, LinkedIn's own engineering team published documentation explaining how the new feed works. Two systems run in sequence: an LLM-based retrieval model that selects candidate posts based on semantic and professional relevance (not who you're connected to), followed by a Generative Recommender that re-ranks those candidates by reading your full interaction history as a pattern. The feed doesn't optimize for your most recent click; it reads your behavior over time as a sequence.
LinkedIn creator and researcher Richard Van Der Blom tracked this shift across 1.3 million posts alongside LinkedIn's engineering documentation and published the numbers:
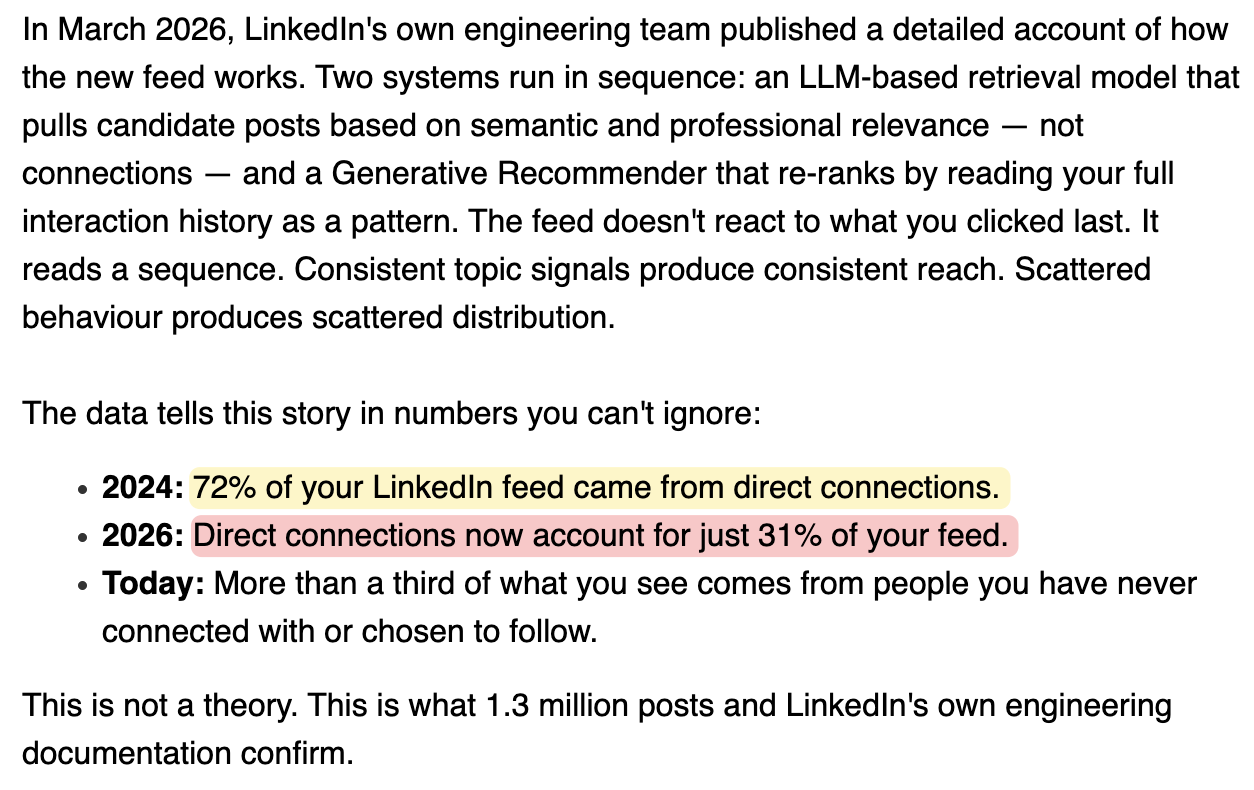
For creators, the implication runs both ways. Your posts now reach people outside your network more than before, but the algorithm decides who based on topic signals, not follower count. Consistent topic focus gives the retrieval model a clear signal. Scattered content gives it nothing to work with.
The shift disproportionately benefits smaller accounts. LinkedIn's own A/B testing of the new system, cited in TrustInsights.ai's unofficial LinkedIn algorithm guide (Ramanujam et al., 2025), produced numbers that are striking at LinkedIn's scale: a +0.8% revenue lift across the full platform, and a +3.29% lift from low-connection users alone. At a company generating billions in revenue annually, a fraction of a percent is a meaningful number. The gains for smaller users were 3–4x the overall average:
The old feed relied on network-based signals that new and small-network users simply don't have. The LLM-based system bypasses that cold-start problem by matching on semantic topic interest instead. Two practical implications follow from this: a 200-connection account posting consistently on a focused topic can now reach a relevant audience the old algorithm would never have surfaced it to; and profile text quality matters most precisely when you have no engagement history, because text is what the retrieval model has to work with.
3. Search Appearances
This is one of the most underused stats on LinkedIn. Navigate to:
It shows you how many times your profile appeared in LinkedIn search results in the past week, broken down by three useful dimensions:
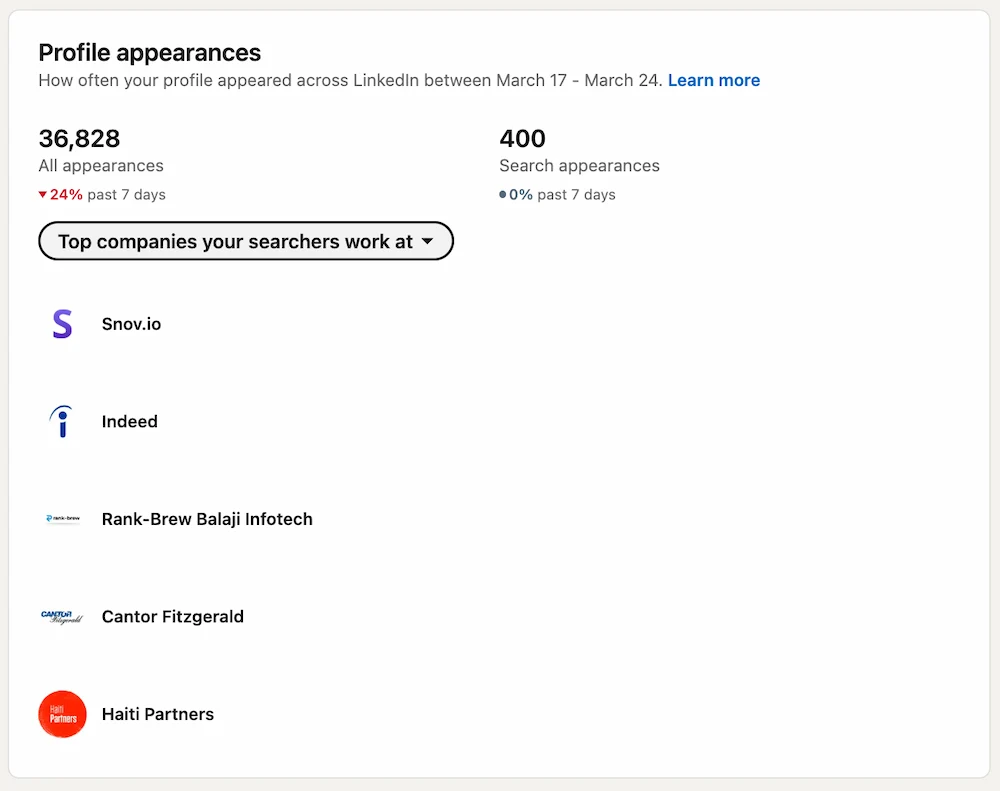
Where Your Searchers Work
You can see which companies the people who found you work at. If you're trying to reach a specific industry or account type, this tells you whether it's working—or whether your profile keywords need adjusting.
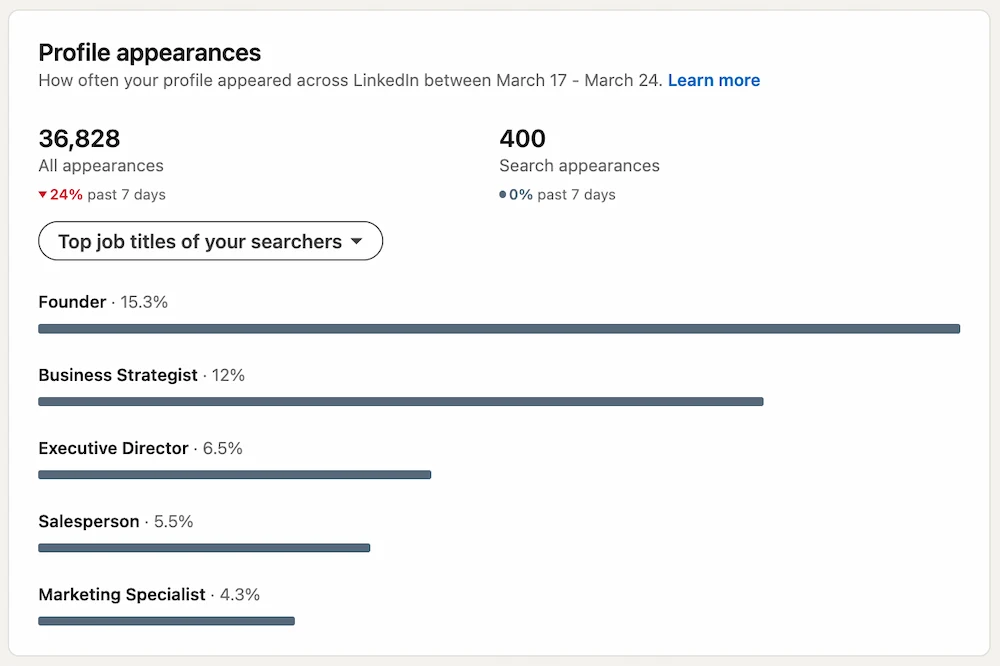
Your Searchers' Job Titles
This tells you what roles are finding you. If you're an SEO consultant but primarily showing up in searches from HR managers, your profile keywords may be pulling the wrong audience.
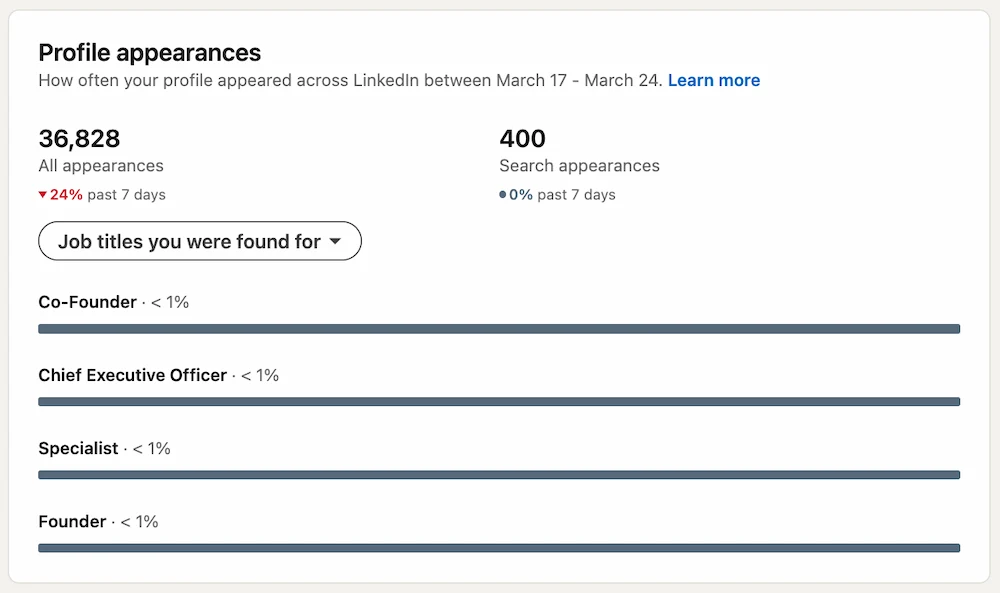
Job Titles You Were Found For
This shows the job titles people were searching for when your profile appeared—not their own title, but the role they were looking to find. If you want to show up for "Co-Founder" or "Chief Executive Officer" searches, this is where you'd find out whether that's happening. Use it to validate your LinkedIn profile optimization is pulling the right searches, or to find titles worth adding to your headline and About section.
Where Your Profile Appearances Actually Come From
LinkedIn has added a "Where you appeared" breakdown to the same analytics page. It shows what share of your total profile appearances came from posts, comments, network recommendations, and search. The numbers are worth seeing:
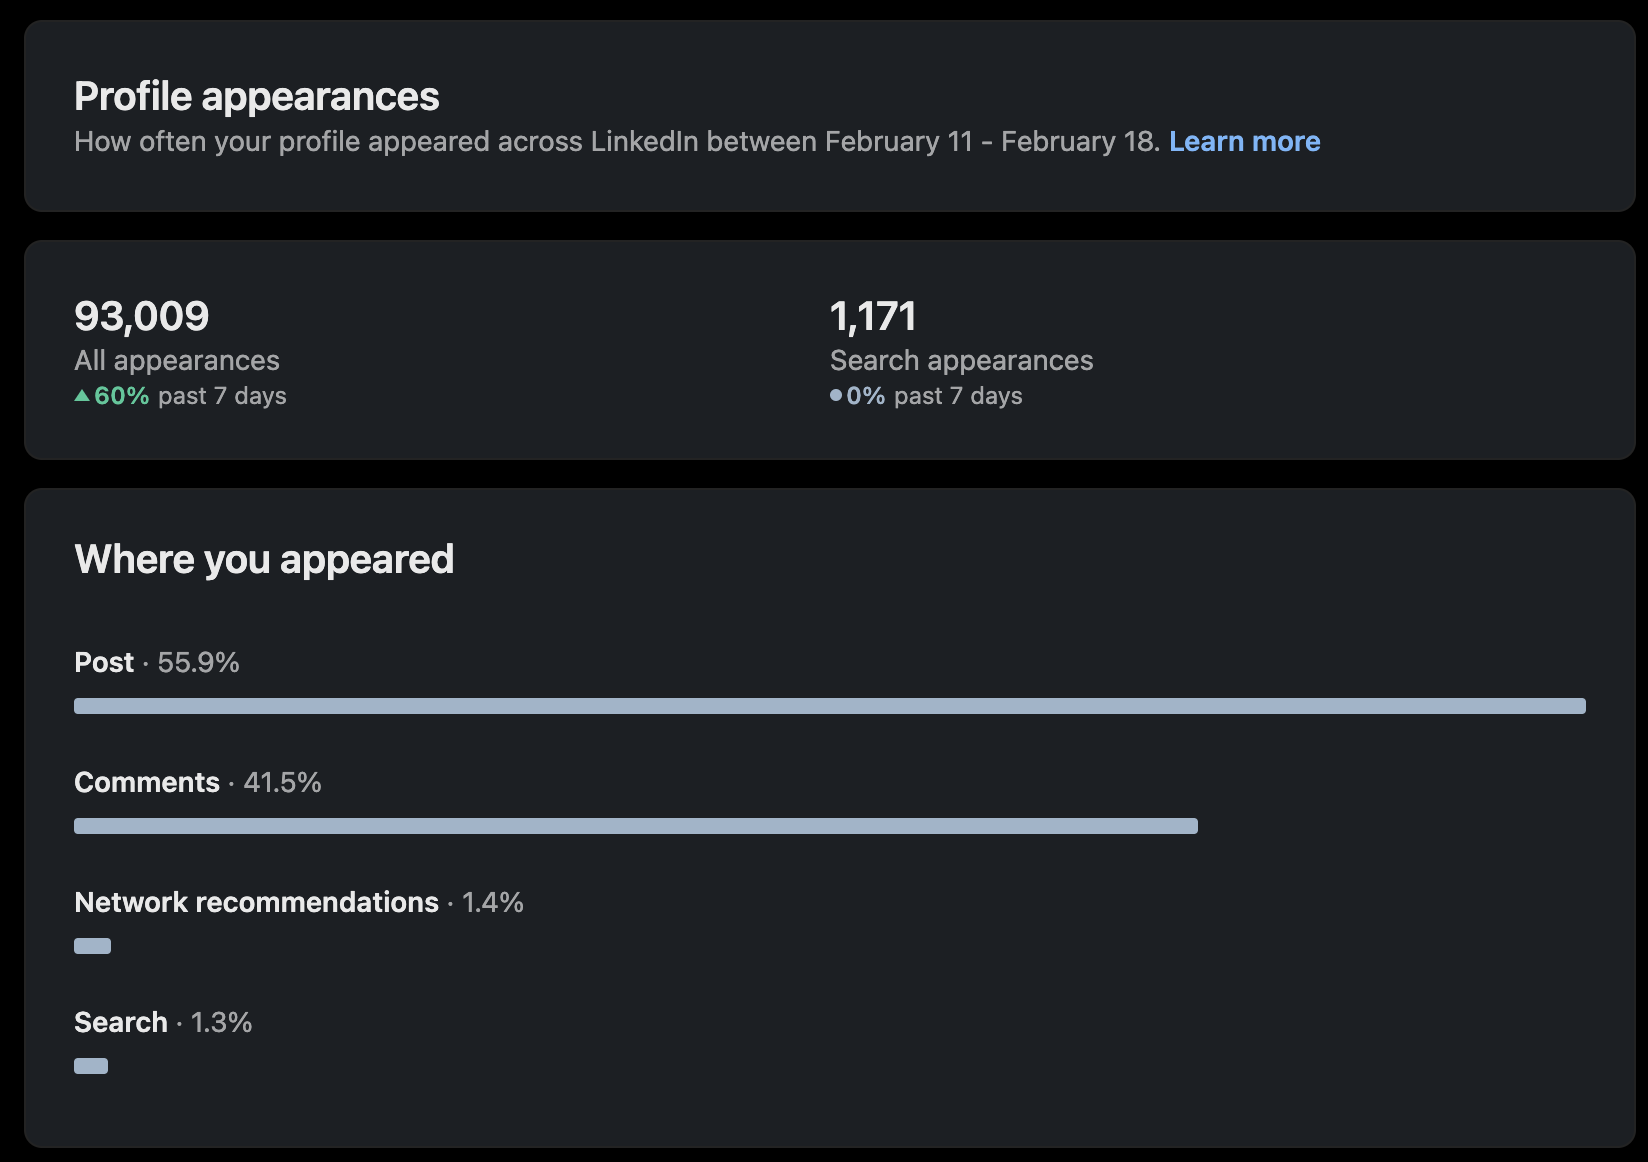
For most active creators, commenting alone accounts for somewhere between a third and half of total profile visibility. If your search appearances feel low, it's not always a keyword problem—often it just means you're not commenting enough.
4. Social Selling Index (SSI)
LinkedIn tucks the Social Selling Index away from normal navigation; you won't find it through the main dashboard. Go directly to:
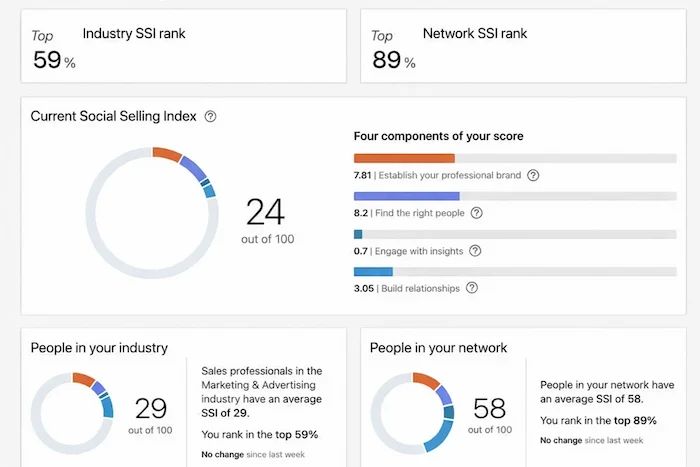
The SSI gives you a score out of 100 based on four pillars:
- Establish your professional brand: profile completeness and content quality
- Find the right people: how you use LinkedIn search and filters
- Engage with insights: frequency of posting and engaging with others' content
- Build relationships: connecting with and interacting with relevant people in your network
Is the SSI worth tracking? For most content creators and consultants: no. It measures recent activity patterns (how much you're searching, connecting, publishing, engaging), but gives you no signal on what's actually working. The score was built for salespeople who need to show a LinkedIn activity number to a manager or client. If that's not your situation, there's nothing here that changes how you'd operate.
5. Bonus: Going Deeper Than LinkedIn's Native Stats
LinkedIn's native stats give you a starting point. What they don't give you is enough to make real decisions. The five areas above are what's available on the free plan, and each has a meaningful gap:
- No historical charts for follower or connection growth
- No engagement rate calculation
- No way to compare performance across posts in aggregate
- No benchmarking against other profiles or accounts in your industry
If you're trying to grow on LinkedIn consistently, or managing content for clients, you need a third-party analytics tool. A good one pulls all of the above into one dashboard, calculates engagement rates automatically, and shows you which posts are actually performing.
What Your Stats Actually Predict
One finding from my research that changes how I think about LinkedIn stats: the strongest predictor of average post engagement isn't impressions—it's comments received (correlation: 0.83). And the strongest predictor of comments received is comments written (0.57).
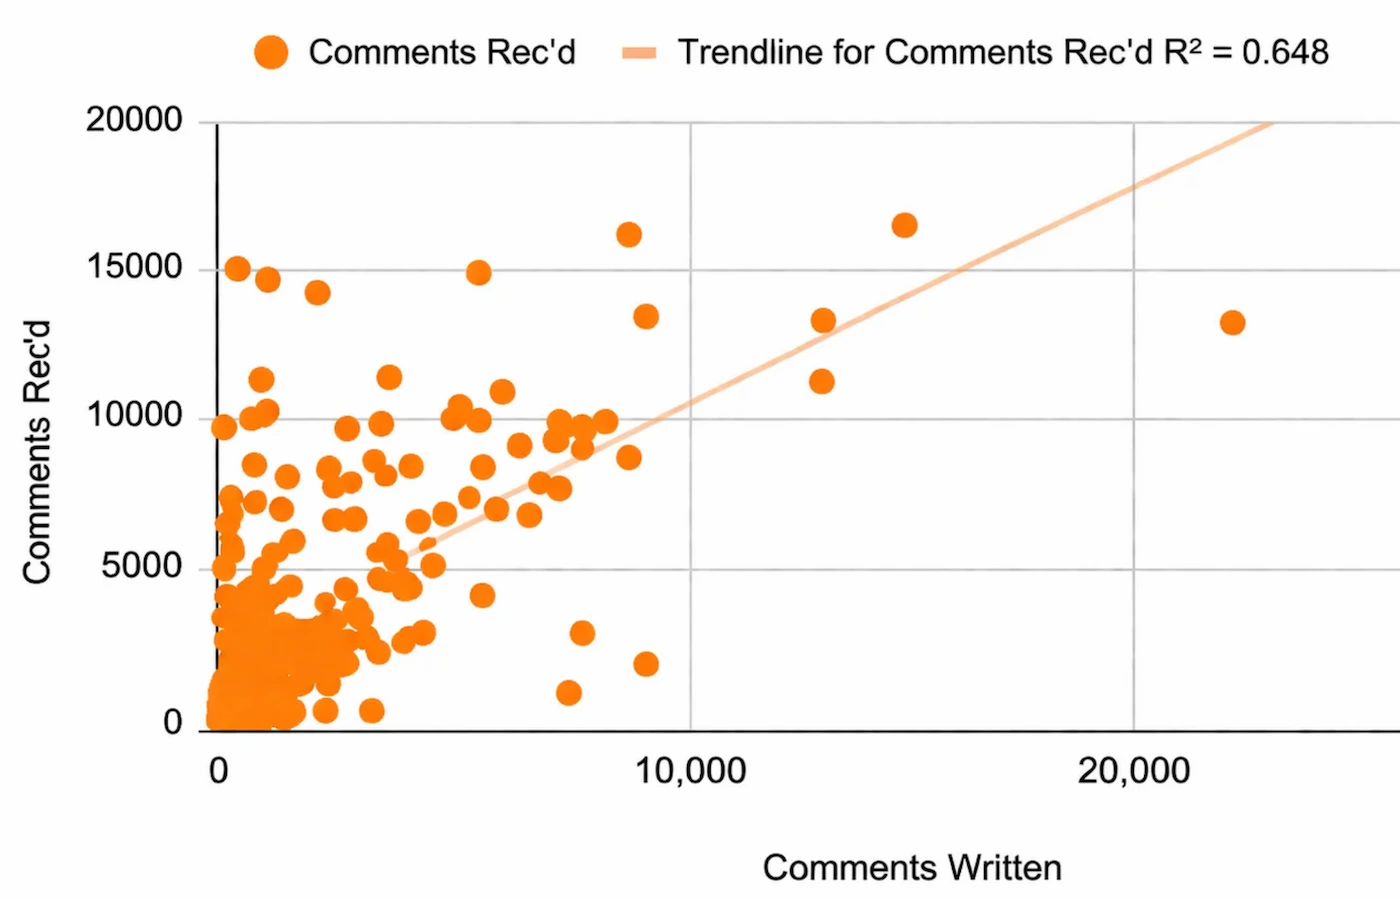
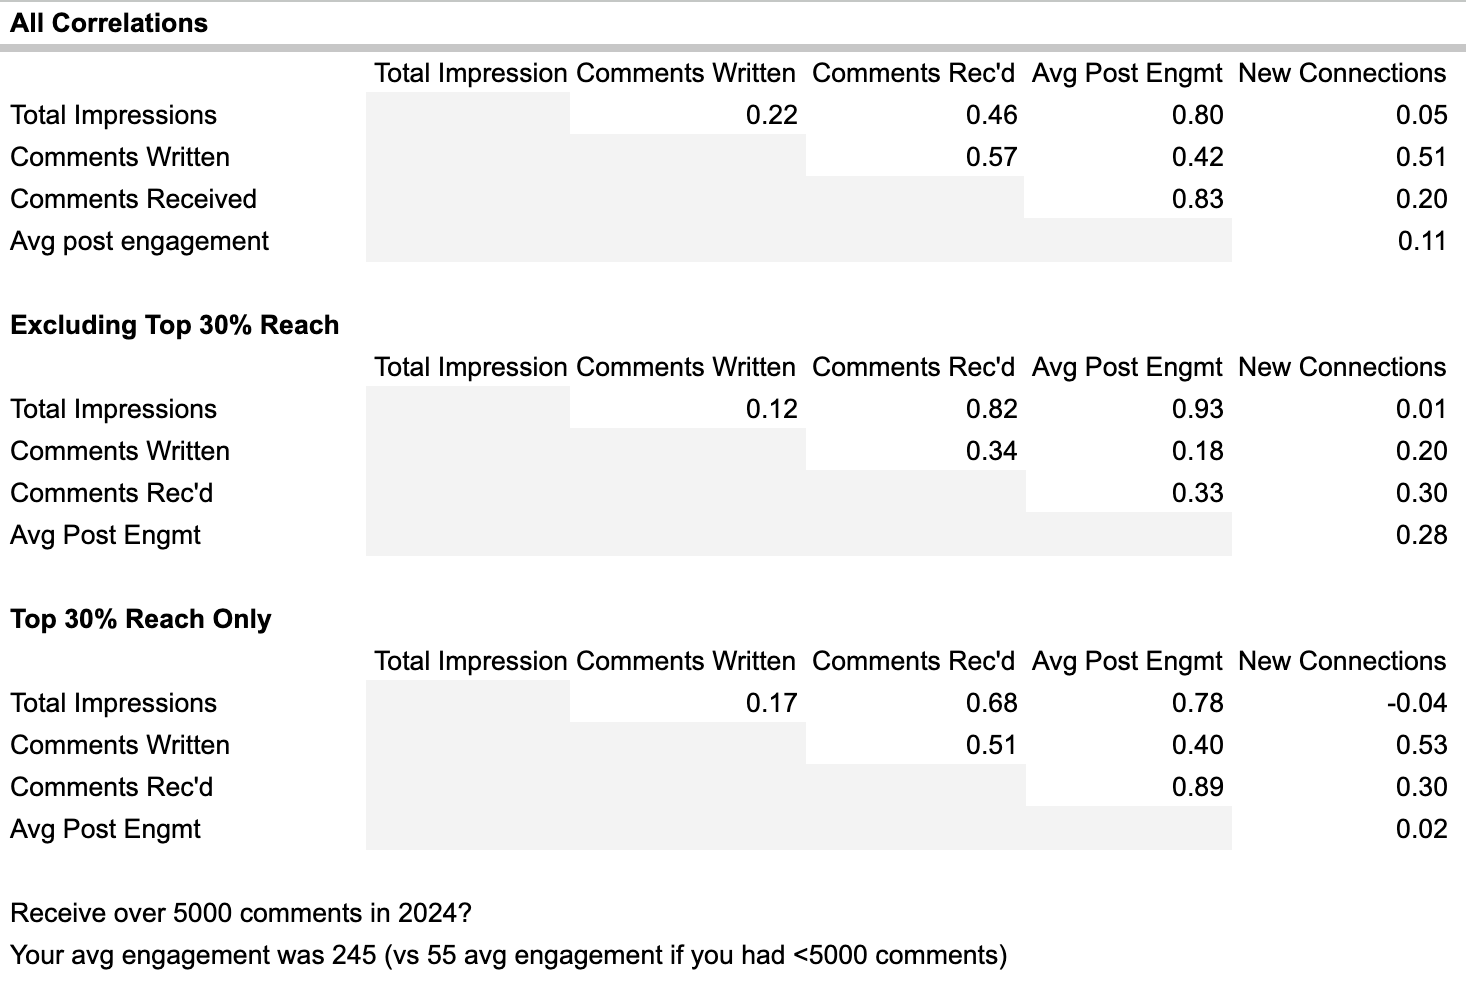
The practical implication: LinkedIn statistics are less about measuring how loud you're broadcasting, and more about measuring how actively you're participating. Impressions tell you your ceiling; comments tell you whether you're building something real underneath it.
In the meantime, our free LinkedIn Engagement Rate Calculator and LinkedIn Post Grader can help you understand how your content is performing right now, no account connection required.
Understand what's working on your LinkedIn
DemandBird helps B2B teams grow their presence on LinkedIn, without the guesswork.
Start Free Trial