Overview
The Analytics tab is a reporting surface, not a live API console. Every number on it comes from snapshots DemandBird has already collected, which is why the page loads instantly and why nothing you do there can burn a platform rate limit.
Pick a platform from the selector at the top, or All platforms for the cross-platform roll-up. DemandBird remembers the platform you were last looking at, so coming back lands you where you left off.
All platforms
The All platforms view charts every connected channel side by side for the same period. Use it to answer the comparative question (“where is the growth actually coming from?”) before you drill into one platform to ask why.
It is a roll-up, so it has no account selector and no sync button of its own. Each platform's own dashboard has both.
Choosing a period
The period picker offers 7 days, 30 days (the default), and 90 days, plus a custom range of up to a year. Every number on the page is scoped to it, and where a comparison is available it is against the equally long window immediately before, so “up 12%” always means “compared with the previous 30 days” rather than compared with nothing.
A custom range cannot run past today, because there is no data there to compare against.
Picking channels
If a workspace has more than one channel on a platform (two LinkedIn profiles, a personal profile and a company page), the Account selector lets you look at any set of them. It is a checkbox list: tick the channels you want, then click Apply.
On LinkedIn the selector groups your channels under Profiles and Company Pages. Personal profiles and company pages report different metrics, so they are never added together:
- Pick only company pages and you get the company page dashboard. Pick several pages and their numbers are added up there.
- Pick profiles, or all LinkedIn accounts, and the numbers cover profiles only. When company pages are part of the selection, a note says they report separately and aren't included, with a link to view those pages.
- Top engagers (the people who reacted or commented most) only exists for company pages, because LinkedIn only names who engaged with a page's posts.
The summary cards
Four cards across the top, labelled for whatever the platform actually reports. The engagement rate card always says what it was divided by, because the denominator is the whole argument:
| Denominator | When |
|---|---|
| Impressions | Platforms that report impressions, such as X. |
| Views | Threads. |
| Reach | Instagram and Facebook. |
| Followers | Platforms that report no impressions at all, such as Bluesky. The card is labelled “Engagement vs. followers” so it is never mistaken for a true rate. |
Do not compare engagement rates across platforms. Compare each platform against its own past.
Follower trend
Follower count over the selected period, so you can line up a jump with the post that caused it. YouTube is labelled subscribers.
Forecast
Click Forecast on a platform's follower card, or on LinkedIn's Follower growth card, to see where your current trend leads. Choose 1 year or 2 years out. About this forecast shows the growth rate it used, per day and per month, and how many days of history it was measured across.
A sudden jump from an account being added to (or removed from) the chart is not follower growth, so the forecast leaves it out and says which jump it skipped, by size and date. It needs about a week of daily history first; until then the card says Not enough history yet.
Format performance
Your post formats (text only, single image, multi-image, document, video, poll, reshare) ranked by median engagement rate for this platform (median engagements per post on Bluesky and Mastodon). The median is the middle post, so one post that went unusually wide can't crown a format. This is the fastest read on the page: if carousels beat text posts three to one on your account, that is a content decision you can make on Monday.
Best time to post
A day-of-week by hour grid showing where your engagement actually lands, in your own time zone.
Cells are medians, not averages, and that is deliberate: one post that went unusually wide should not crown 3pm on a Tuesday as your best slot forever. Once you have a picture you trust, encode it in your posting schedule and let the queue do the rest.
Audience demographics
Follower breakdowns where the platform provides them: Instagram, Threads, and LinkedIn company pages. Platforms that do not expose demographics simply do not show the card.
Recent posts
One row per post with that platform's own metrics and a computed engagement column. The table names its own formula in the intro line, so you always know what the number means. Click a row to expand its velocity chart: how the post accumulated impressions or engagement over the hours after it went out, on platforms that support it.
Each row shows the avatar of the channel it was posted from and a thumbnail of the post's image. A post with more than one image shows +N on the thumbnail for the rest. Imported LinkedIn profile posts have no thumbnail, because LinkedIn doesn't share their images.
Rows carry their tags, which is what turns the table into an answer: if every post tagged “Personal story” is in the top ten, you have learned something.
Deleted posts. When you delete a LinkedIn or Bluesky post on the platform, DemandBird notices. Once the post has been missing across several checks spanning at least 48 hours, it drops out of the posts table and the totals. If it turns up again, it comes back. Other platforms don't tell us about deletions, so their deleted posts stay in the table.
Freshness and Sync now
Each dashboard stamps when its data was last collected, so an unexpectedly flat chart is distinguishable from a stale one. Numbers refresh on their own in the background.
Posts refresh on different schedules depending on their age. A post under two hours old refreshes about every 15 minutes, and a post more than 30 days old refreshes about once a week. So the posts table can hold rows captured minutes ago next to rows captured days ago.
That is why the posts table shows two times. Last checked is the most recent update to any post on screen, which tells you the refresh is still running. Oldest stats is the oldest capture among the posts on screen, so every row is at least that fresh. Quote that one in a report. When every row was captured at the same time, only one time is shown.
Sync now pulls fresh numbers on demand. It is throttled to once every 15 minutes per platform: platform metrics update slowly, and repeated manual syncs would spend API quota without changing a single number.
Exporting
Every dashboard exports two CSVs for the selected period: a summary (the headline numbers) and posts (one row per post with its metrics). The all-platforms view exports one row per platform. Use them for a client report or to do your own analysis in a spreadsheet.
The All platforms file has no total row. Platforms measure reach in different ways, so adding them up would give a number that means nothing. A number a platform doesn't report shows as -, not 0, so a gap is never mistaken for a real zero.
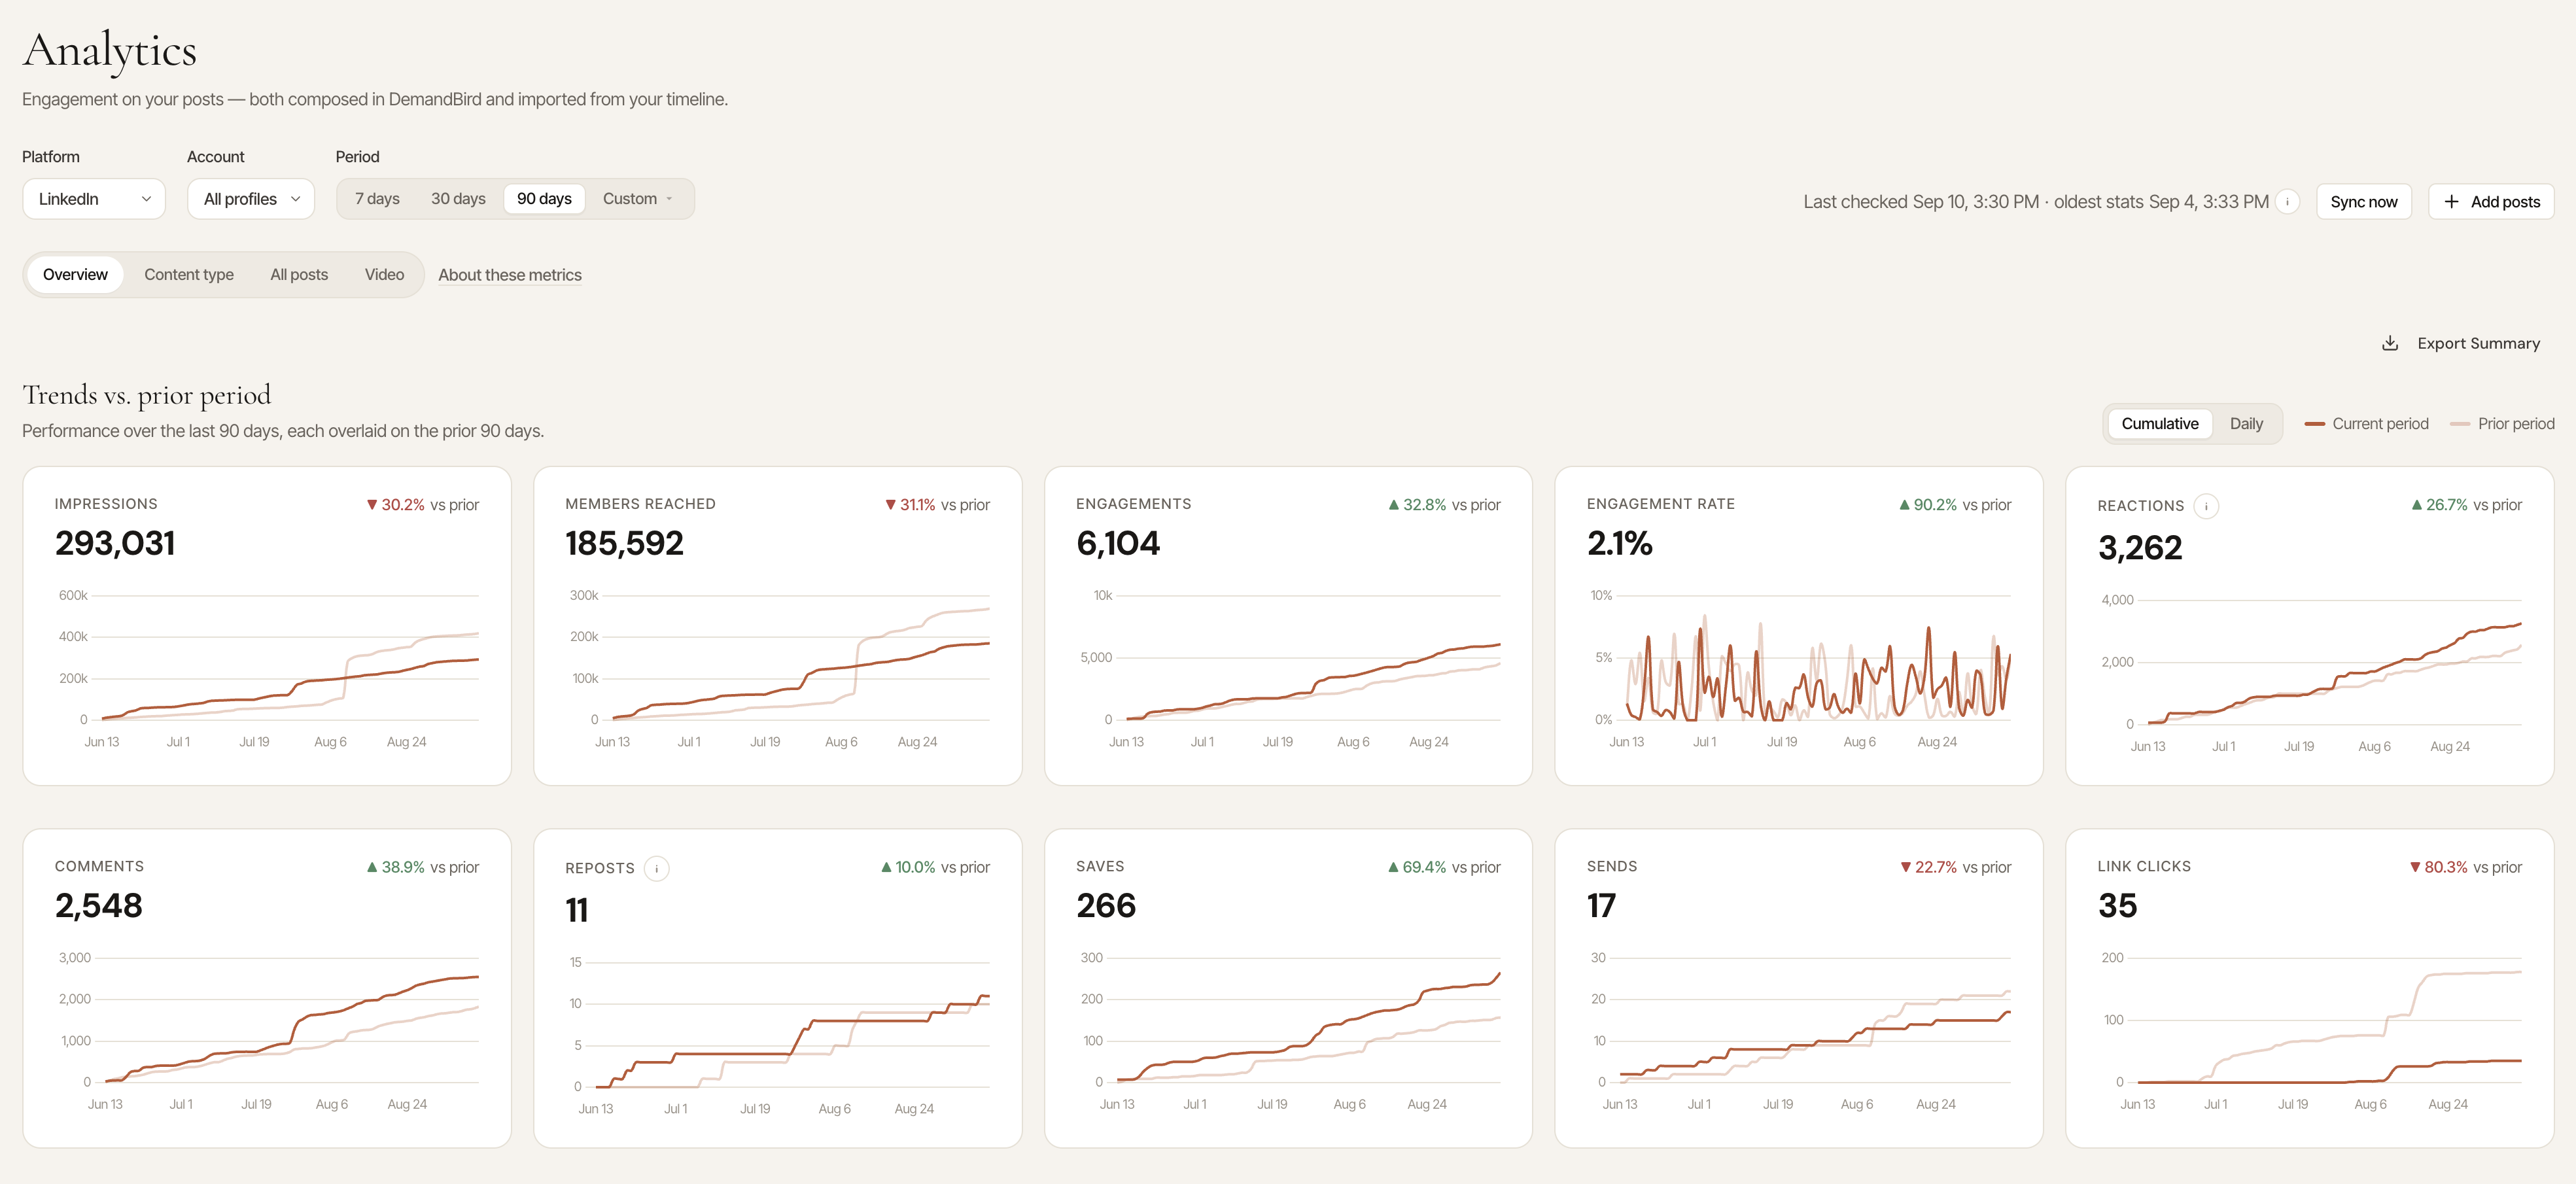
LinkedIn gets a richer dashboard than the rest, with Overview, Content type, and All posts tabs (plus Video once you've posted video), follower growth, engagement mix, link clicks, reaction breakdowns, and top engagers for company pages. Personal profiles and company pages are reported separately, because LinkedIn exposes different metrics for each.
Video view. Shown once you've posted video. It covers watch time, average watch time (watch time divided by views), and views. There is no period-over-period comparison, because LinkedIn doesn't report these numbers by day.
Reaction breakdowns. Reactions are split by type (Like, Celebrate, and so on) for personal profiles as well as company pages, as exact counts rather than shares.
Analytics off
Posting works as soon as you connect. LinkedIn asks for a separate one-time approval before it shares per-post impressions and engagement. A profile without it shows Analytics off in Connected Accounts. Enable it there and DemandBird backfills up to 400 days. Company pages don't need this approval, so they show neither the badge nor the button.
Not found on LinkedIn
A post that LinkedIn has stopped returning says Not found on LinkedIn instead of Metrics pending. LinkedIn is no longer returning this post. It may have been deleted. If it is still live, metrics resume on their own.
How reactions are counted
Personal-profile reactions are counted from the actual reactions on each post, which matches what LinkedIn shows the author (within about 1%). LinkedIn's creator-analytics “Reaction” figure can run up to 2x higher, so we don't use it. The same number feeds engagement rate, the CSV exports, and the MCP analytics tools.
Why reposts read low
LinkedIn's API only counts reposts that add a comment (“repost with your thoughts”). Instant reposts are left out, so Reposts, Lift, and the account-level Share rate card read lower than the repost count LinkedIn shows on the post itself.
Lift
Lift is reposts + saves + sends + new followers: the actions that carry a post past the people who already follow you. It is LinkedIn only, and it replaced the per-post Share rate column in All posts. Share rate still exists as a card under Performance ratios on the Overview tab, for the account as a whole.
The arrow next to a post's Lift compares it with your median Lift over the last 90 days, not with the posts on screen, so filtering the table doesn't move it. A post close to your median shows a quiet ≈. With fewer than 5 posts to compare against, there is no arrow.
Profile views (members who viewed your profile after seeing the post) is its own column and is not part of Lift.
Medians
Wherever a post is compared with “your usual”, the usual is your median post, not the average. That covers the vs median arrows in All posts, the comparisons in a post's expanded detail, the dashed Median post line on the velocity chart, and format rankings. One viral post can drag an average a long way; it barely moves the median.
Tagging from All posts
The All posts table has a Tag column. Click + Tag on a row to add or remove tags without leaving Analytics. This works for imported posts too. Seats that can't edit posts see the tags but can't change them.
A post's expanded detail
Expanding a post shows how it evolved against your median post, and a Post anatomy panel: format, characters, the hook (characters before the first line break), the text before “see more”, lines, hashtags, and emoji, plus traits such as bullets, a number or a name in the opening, and links in the body.
Who reacted. A post's analytics page lists the people who reacted to it. LinkedIn only shares those names for company page posts, so a personal profile post says so instead of listing anyone.
Content type: by format or by tag
The Content type tab opens with a Break down by switch: Format or Tag. It re-cuts every chart and table on the tab, so you can ask “which formats work?” and “which of my themes work?” with the same tools.
In Tag mode the tab shows up to 6 tags (the ones with the most impressions), with Untagged last. A post with several tags counts once for each tag, so rows can overlap. That is why the bottom row is every post in the period rather than the rows added up.
The breakdown table has a Total / Median per post toggle. Total tells you where most of your numbers came from; Median per post tells you what a typical post of that format or tag earns, which is fairer to one you post rarely.
Reach × resonance chart
On the Content type tab, a bubble chart plots each format or tag, so you can see which ones get seen and which ones land. The horizontal axis is Median impressions or Median members reached. The vertical axis is Discussion rate (comments per 1,000 impressions), Engagement rate, Follower efficiency, or Lift per 1k.
Your choice of axes is remembered for next time. Follower efficiency and Lift per 1k only appear when LinkedIn reports the data they are built from.
Format performance and Unknown
Imported posts often carry no information about their format. When we can't detect one, the post shows as Unknown and is left out of format rankings, instead of being counted as a text post. You can set the format by hand on the post (Set the format), and clear it again later.
Your LinkedIn history
LinkedIn's API does not expose your history, so for the full picture you import LinkedIn's own data export once. It appears on this page as the Your LinkedIn history section, which always covers all time (the period picker doesn't apply) and follows the profile selector. How to import it: LinkedIn Analytics import →
You can also add individual LinkedIn posts to the dashboard by pasting their URLs, one per line, which is useful for posts published before you connected the account.
Asking Claude for your numbers
If you use the DemandBird MCP server, the same data is readable in plain English from Claude: an analytics summary with period-over-period deltas, your best and worst posts by any metric, full metrics for a single post, your best posting slots, format rankings, and audience demographics. Everything is read-only, and it reads from exactly the numbers this page shows.